
Optimization#
Optimzation asks us to:
Find \(x\) that minimizes \(f(\vec{x}\)) subject to \(\vec{g}(\vec{x}) = 0\) and \(\vec{h}(\vec{x})\ge 0\)
\(f\) is the objective function and typically a scalar
\(\vec{g}(\vec{x})\) is a list of equality constraints
\(\vec{h}(\vec{x})\) is a list of inequality constraints
Maximization for \(f\) is mearly minimization of \(-f\).
Optimization differs from root finding in the constraints and smoothness of \(f\).
We saw with root finding that using gradient information to help search algorithms has important benefits. That remains true in optimization, but since they are often high dimensional (\(\vec{x}\) is a large vector), and \(f\) is not necessarily well behaved, great value is placed on methods that do not require (direct) gradient / Hessian calculations.
Local vs Global minima#
Even in 1D, optimization is confounded by local minimima. The lowest of the local minima is the global minimum.
There is no good way to ensure a local minimia is a global one without calculating and comparing them all!
There are lots of algorithms that attempt to find the global minimum. They either:
launch multiple minimizers over the range of arguments
typically involve preturbing good solutions in an attempt to escape from local minima basins.
Interestingly, many of these methods are modelled after nature! (Why?)
Genetic algorithms - mutations, cross-overs, selection)
Simulated annealing - metalurgical process that accepts worse solutions)
Partical swarm - Mimics swarming behaviour to track multiple solutions
Amoeba search (which we will talk about)
Introduction of constraints can further complicate things since sometimes the minimima is at a bound!
Example: local and global minimima#
Minimize \(f = x^2 - cos(5 x)\)
import matplotlib.pyplot as plt
import numpy as np
import scipy as sp

x = np.linspace(-2, 2, 100)
f = lambda x: x**2 + -np.cos(5 * x)
y = f(x)

plt.plot(x, y)
plt.xlabel("x")
plt.ylabel("F(x)")
plt.title("Function with Local and Global Minima")

# Annotate the global minimum
plt.scatter(0, np.min(y), color='red', label='Global Minimum')
plt.annotate('Global Minimum', xy=(0, np.min(y)), xytext=(0, np.min(y) + 1), ha='center', arrowprops=dict(arrowstyle='->'))

# Annotate a local minimum (approximately)
opt =  sp.optimize.minimize(f,1)
local_min_x = opt.x
local_min_y = opt.fun
plt.scatter(local_min_x, local_min_y, color='blue', label='Local Minimum')
plt.annotate('Local Minimum', xy=(local_min_x, local_min_y), xytext=(local_min_x, local_min_y + 1), ha='center', arrowprops=dict(arrowstyle='->'))

plt.legend()
plt.show()
---------------------------------------------------------------------------
TypeError                                 Traceback (most recent call last)
File ~/.local/lib/python3.12/site-packages/matplotlib/backend_bases.py:2257, in FigureCanvasBase.print_figure(self, filename, dpi, facecolor, edgecolor, orientation, format, bbox_inches, pad_inches, bbox_extra_artists, backend, **kwargs)
   2254     # we do this instead of `self.figure.draw_without_rendering`
   2255     # so that we can inject the orientation
   2256     with getattr(renderer, "_draw_disabled", nullcontext)():
-> 2257         self.figure.draw(renderer)
   2258 else:
   2259     renderer = None

File ~/.local/lib/python3.12/site-packages/matplotlib/artist.py:94, in _finalize_rasterization.<locals>.draw_wrapper(artist, renderer, *args, **kwargs)
     92 @wraps(draw)
     93 def draw_wrapper(artist, renderer, *args, **kwargs):
---> 94     result = draw(artist, renderer, *args, **kwargs)
     95     if renderer._rasterizing:
     96         renderer.stop_rasterizing()

File ~/.local/lib/python3.12/site-packages/matplotlib/artist.py:71, in allow_rasterization.<locals>.draw_wrapper(artist, renderer)
     68     if artist.get_agg_filter() is not None:
     69         renderer.start_filter()
---> 71     return draw(artist, renderer)
     72 finally:
     73     if artist.get_agg_filter() is not None:

File ~/.local/lib/python3.12/site-packages/matplotlib/figure.py:3282, in Figure.draw(self, renderer)
   3279             # ValueError can occur when resizing a window.
   3281     self.patch.draw(renderer)
-> 3282     mimage._draw_list_compositing_images(
   3283         renderer, self, artists, self.suppressComposite)
   3285     renderer.close_group('figure')
   3286 finally:

File ~/.local/lib/python3.12/site-packages/matplotlib/image.py:133, in _draw_list_compositing_images(renderer, parent, artists, suppress_composite)
    131 if not_composite or not has_images:
    132     for a in artists:
--> 133         a.draw(renderer)
    134 else:
    135     # Composite any adjacent images together
    136     image_group = []

File ~/.local/lib/python3.12/site-packages/matplotlib/artist.py:71, in allow_rasterization.<locals>.draw_wrapper(artist, renderer)
     68     if artist.get_agg_filter() is not None:
     69         renderer.start_filter()
---> 71     return draw(artist, renderer)
     72 finally:
     73     if artist.get_agg_filter() is not None:

File ~/.local/lib/python3.12/site-packages/matplotlib/axes/_base.py:3372, in _AxesBase.draw(self, renderer)
   3369 if artists_rasterized:
   3370     _draw_rasterized(self.get_figure(root=True), artists_rasterized, renderer)
-> 3372 mimage._draw_list_compositing_images(
   3373     renderer, self, artists, self.get_figure(root=True).suppressComposite)
   3375 renderer.close_group('axes')
   3376 self.stale = False

File ~/.local/lib/python3.12/site-packages/matplotlib/image.py:133, in _draw_list_compositing_images(renderer, parent, artists, suppress_composite)
    131 if not_composite or not has_images:
    132     for a in artists:
--> 133         a.draw(renderer)
    134 else:
    135     # Composite any adjacent images together
    136     image_group = []

File ~/.local/lib/python3.12/site-packages/matplotlib/artist.py:71, in allow_rasterization.<locals>.draw_wrapper(artist, renderer)
     68     if artist.get_agg_filter() is not None:
     69         renderer.start_filter()
---> 71     return draw(artist, renderer)
     72 finally:
     73     if artist.get_agg_filter() is not None:

File ~/.local/lib/python3.12/site-packages/matplotlib/text.py:2209, in Annotation.draw(self, renderer)
   2207 if renderer is not None:
   2208     self._renderer = renderer
-> 2209 if not self.get_visible() or not self._check_xy(renderer):
   2210     return
   2211 # Update text positions before `Text.draw` would, so that the
   2212 # FancyArrowPatch is correctly positioned.

File ~/.local/lib/python3.12/site-packages/matplotlib/text.py:1809, in _AnnotationBase._check_xy(self, renderer)
   1806 b = self.get_annotation_clip()
   1807 if b or (b is None and self.xycoords == "data"):
   1808     # check if self.xy is inside the Axes.
-> 1809     xy_pixel = self._get_position_xy(renderer)
   1810     return self.axes.contains_point(xy_pixel)
   1811 return True

File ~/.local/lib/python3.12/site-packages/matplotlib/text.py:1800, in _AnnotationBase._get_position_xy(self, renderer)
   1798 def _get_position_xy(self, renderer):
   1799     """Return the pixel position of the annotated point."""
-> 1800     return self._get_xy(renderer, self.xy, self.xycoords)

File ~/.local/lib/python3.12/site-packages/matplotlib/text.py:1696, in _AnnotationBase._get_xy(self, renderer, xy, coords)
   1694 xcoord, ycoord = coords if isinstance(coords, tuple) else (coords, coords)
   1695 if xcoord == 'data':
-> 1696     x = float(self.convert_xunits(x))
   1697 if ycoord == 'data':
   1698     y = float(self.convert_yunits(y))

TypeError: only 0-dimensional arrays can be converted to Python scalars
<Figure size 640x480 with 1 Axes>
Example: Eggholder surfaces#
Minimize \(y \cdot sin(\sqrt{\|x + y\|}) + x \cdot sin(\sqrt{\|x - y\|})\)
import plotly.graph_objects as go
# import plotly.io as pio
# pio.renderers.default = "jupyterlab"
import numpy as np

def eggholder(x, y):
  return y* np.sin(np.sqrt(abs(x + y ))) + x * np.sin(np.sqrt(abs(x - y)))


x = np.linspace(-512, 512, 100)
y = np.linspace(-512, 512, 100)
X, Y = np.meshgrid(x, y)
Z = eggholder(X, Y)/10

fig = go.Figure(data=[go.Surface(z=Z, x=X, y=Y)])
fig.update_layout(title='Eggholder Function', autosize=False,
                  width=500, height=500,
                  margin=dict(l=65, r=50, b=65, t=90))
fig.show()
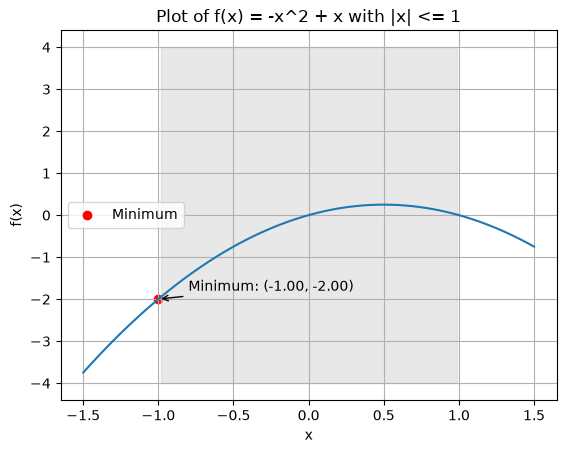
Example: Constrained minimization#
Minimize \(x^2+x\) such that \(\|x\| \le 1\)
import matplotlib.pyplot as plt
import numpy as np
import scipy.optimize as optimize

# Define the function
def f(x):
  return -x**2 + x

# Define the bounds for x
bounds = (-1, 1)

# Create a range of x values
x = np.linspace(-1.5, 1.5, 100)

# Calculate the corresponding y values
y = f(x)

# Find the minimum using scipy.optimize.minimize_scalar
result = optimize.minimize_scalar(f, bounds=bounds)

# Get the x value of the minimum
x_min = result.x

# Get the y value of the minimum
y_min = f(x_min)


# Plot the function
plt.plot(x, y)
plt.xlabel('x')
plt.ylabel('f(x)')
plt.title('Plot of f(x) = -x^2 + x with |x| <= 1')

# Plot the minimum
plt.scatter(x_min, y_min, color='red', label='Minimum')
plt.annotate(f'Minimum: ({x_min:.2f}, {y_min:.2f})', xy=(x_min, y_min), xytext=(x_min + 0.2, y_min + 0.2), arrowprops=dict(arrowstyle='->'))

plt.fill_between(x, -4, 4, where=(np.abs(x) <= 1), color='lightgray', alpha=0.5)
plt.legend()
plt.grid(True)
plt.show()